“Why” and “What” of Observability
Like we always do, to understand a word – break it into as small a sensible part as possible and then, let’s take a relatable example and delve into it further.
Observe + ability = Ability to observe, is what it boils down to. Therefore, I guess, now it is simpler to understand that Observability is the ability to observe. But, observe what? Is the next question to be addressed, to add more context.
Here in our case, it is the ability to observe our system.
What is a system in this context? It could be the super set of all the components that our technological interfaces, non-technological interfaces to our clients/customers or our internal users, operate on. Or in other words, it could be any API service, or a database server or the front-end of an application service such as a banking app on our mobile phone. These interfaces or components could also be the ones that rely on the technological interfaces but are directly impacted by any reliability issues of the underlying layer. It could be an e-surgery on a video call platform such as Zoom; where a loss of connectivity due to app downtime would be costing lives not money, which is precisely priceless and irreversible, yet.
Basically, I would like to attribute the inspiration to this concept from our own body which I will be using as an analogy to explain Observability, that way, we don’t have to remember anything without logical reasoning. Let’s go!
In order to observe, if everything is functioning per expectation in our body, we need to observe ourselves. Luckily, the most complex observability infrastructure is built into our bodies and is ready to use and train for further capabilities.
For instance, if we can try to relate, we have pain or anything uneasy a feeling, as a signal to our brains, transmitted from each cell of our body that relentlessly reads the changes in temperatures, chemical compositions, wear and tear and so on, as a response to any type of a stimulus that can induce pain or needs attention in us. Again, pain is a different story, because, our body had already been pre-programmed to be able to understand, detect and represent what is pain and what is pleasure using the complete stretch of our body that is filled with sensors of various kinds where, every cell can basically respond to the need. Further, these signals are transmitted to the brain cells such that our brain can understand and help us respond to the same.
This part here – our sensory system, can be found very much analogous to the,
- Data persistence – remembering in my head that my knee was hurt when I tripped on a metal rod, could be a time series database similar to cortex or Datadog or Splunk on the non-living side of the world
- Data processing – the very ability of our brain to interpret signals and generate signals to trigger response actions, could be the business logic in interpreting the metrics/logs/traces data and of course the computational power associated with the same
- Visualization – marking the location of pain and enabling the eye sight to look at the location of the body in pain, could be a Grafana/Datadog dashboard for instance, to help us analyze and diagnose the situation.
- Remediation – browse through possible solutions and zero down on the most optimal one based on the available resources, like massaging gently perhaps as the first response, could be a restart of a pod that was down due to lack of memory as a first step of remediation.
Let’s take another example. A flair of a burning substance lands on our skin, we respond to it in no time. But, have we ever wondered about the flow of data there, between the region of contact with heat, to our brain cells, to our limbs that got into action to move the hot object away? That’s awesome, right? I hope we’re able to relate to the above aspects with this example, already.
The body hair, which we usually consider to be mostly an aesthetic aspect – is the first line of defense to our bodies. Can you imagine that each hair and the follicle it’s rooted into, work also as 24×7 active sensors that sense any change to the environment around and send accurate signals to our brain, so that our brain can interpret this signal and send out stimulus to trigger response actions to various bodily parts that take shape as our reflexes, and help us move our organs to take actions to safeguard our self from the harm detected. In this case it is preventing our epidermal layers from being burnt.
Imagine that we lost the sense of touch. I wouldn’t even know when I’d start feeling the burn or pain finally, tbh.
That sums observability up in one line.
Coming back to our context of technological systems, the sense organs can be replaced with, or are analogous to the component that can observe/monitor activities and changes in the system. But unfortunately, if there is an API server that is built to serve the requests coming in, it does not inherently have the ability to tell if something is not right, except for throwing exceptions that should be handled in order for the impact to not reach our end users (could be one of our most valued customer. If I were asked why I mostly refer to only the most valued customer – it is because, treating the problem to be the most critical one, opens doors to bring the most reliable and durable solution on to the plate and also every customer should be considered the most valued one, especially when formulating solution to a problem, for we do not know, who knows who and also, why not?, I’d ask myself and I didn’t get any answer haha), that can make them think for a second, about looking for an alternative banking option in this world of endless options, due to the dissatisfaction experienced by the customer for a fraction of a second.
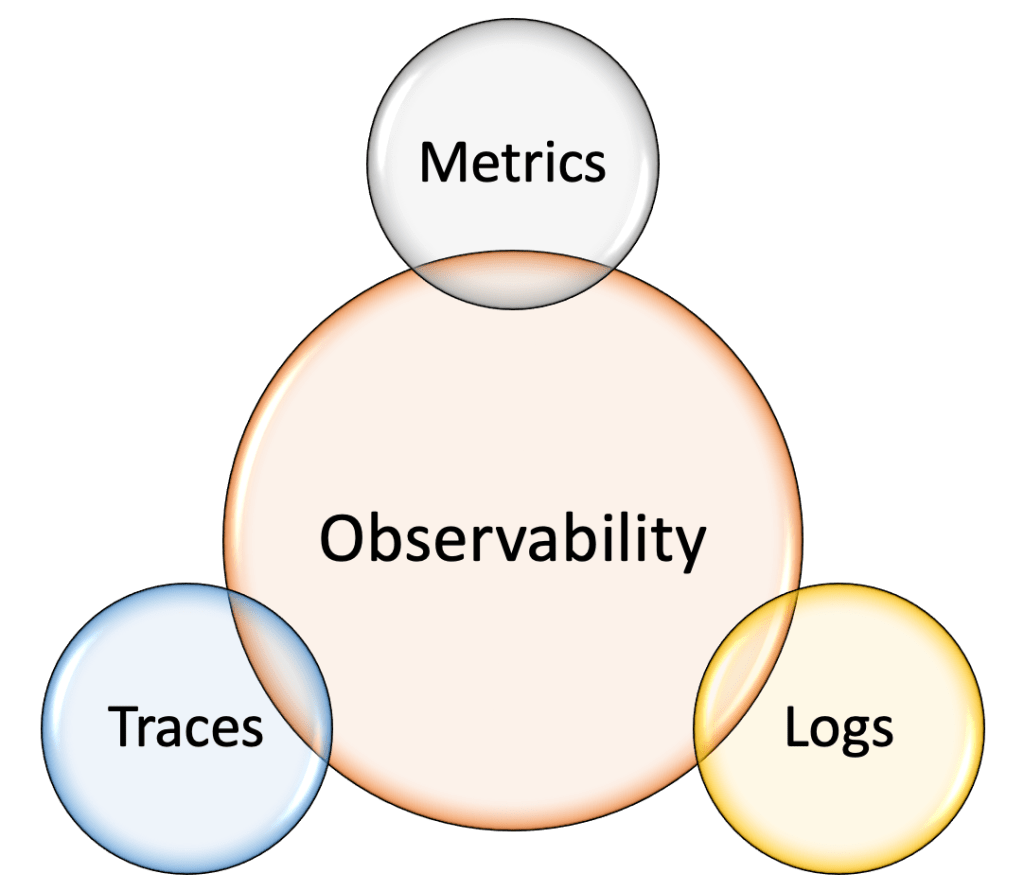
Here, what needs to be underlined is that, this dip in the quality of experience level of our customer should be mitigated before it could reach them. And, this is possible only if we have a solution in place that can help us observe the changes in the system and generate a real time representation of the state of the system – which we can call, the metrics, logs, or traces or any time stamped information about the system (analogous to the signals that our body hair or skin would generate and transmit to our brain cells) that can be transmitted, persisted and analyzed against the thresholds that are predetermined, in order to also trigger remedial actions if need be, so that the impact is contained, to begin with and also healed further, with least human intervention, as much as possible.
Therefore, in order to achieve this goal of ours, we would need sensors similar to our bodies’ that can monitor the system for us and generate time-stamped data that could represent the system being monitored as accurately as possible. Since our services are not naturally equipped with such sensors, we would have to either,
– build our own Observability library that can be consumed by our applications as a dependency during the compile time and activated to monitor the app service’s activities during runtime.
– or, rely on existing tools in the market such as OpenTelemetry or Datadog agents that can be plugged into our byte code to monitor our services and seamlessly collect application health data.
Each of the above approaches have their own pros and cons. Although, it might sound highly opinionated, I personally see the vulnerability we would be signing up for, by allowing an external binary to be able to run alongside of our source code. But, as always, we need to find the right balance. And, in this case we find balance in trusting the external libraries doing the redundant job of collecting information and monitoring our systems for us, in return of which we get to free our hands around managing these libraries and their upgrades, while being able to focus on acting on these data points and not having to reinvent the wheel.
Thus we have an observability library, that will be consumed by the application services, and runs alongside of the application byte code, generates metrics data, exposes them at a predetermined location, adding no additional latency that is considerable or significant at the scale of our operations, because there’s practically never a zero latency as we live in the world of time, where the time is always ticking at a constant rate at a height h above the surface on this planet. It is only a relative experience. We cannot humanly all naturally measure in milliseconds and so do we say “in the blink of an eye” to refer to something that happened within a fraction of a second.
These metrics that are generated at the app level, are collected by our scraping agents or metrics collectors that can be channeled to various components that can help us analyze, interpret, diagnose and also come up with remediation, if need be, based on the SLIs, SLOs, and SLAs (these can be delved into separately in another blog, perhaps). But in simpler words,
- if our body cannot take any heat beyond 28 degree Celsius, then this could be treated as the SLA (a Service Level Agreement); Analogous to a 200ms response time to any request served by an app service.
- thus the temperature readings from our epidermal cells become the SLIs (Service Level Indicators); Analogous to the time taken by the 95th percentile of the http server requests coming in to an API server.
- and, the objective of not letting any organ of our body to reach such temperatures becomes the SLO (Service Level Objective); Analogous to the throughput of an API service over a span of certain time period meeting a pre-determined up-time.
These thresholds can further be attached to an alerting mechanism that can trigger signals or response actions to the appropriate teams, analogous to our hands coming into action to move the hot object off of our skin in the above example. Therefore, having a solution in place to monitor our systems becomes a primary need as the system scales, regardless of whether we are on-premises or on cloud.
Choosing the channel to move the information thus collected for further processing is mostly prone to changes in the market. We should build our connections with the external interfaces that help us achieve observability with a futuristic approach, where we do not end up in long-term vendor lock-ins (especially the ones we would find it hard to get out of), placing ourselves in a fashion such that, all our external interactions are replaceable or disposable, if need be.
Let’s consider one last example to understand the Why of observability.
For instance, if a pod failed due to resource constraints, then increase the size of the pod automatically, as the first line of response that could prevent the impact from reaching the end user who had just tapped “Make payment” on their mobile banking app. Further, this same issue can be investigated and remediated around why the pod ran short of resources. It could have been a transient issue or something with the code that resulted in an OutOfMemory Exception. But, regardless of the type of the issue, we should be more interested in the fact that, we were able to save a customer in that span of a few seconds, which is the most valuable rationale of having Observability built into our system. Even casually multiplying the effect with the order of magnitude at which our services are utilized by our customers, would make it a huge impact to our reputation which is way more concerning than the financial hit; for, money can be earned back, but not the trust, as easily.
In essence, we are building, protecting and strengthening the trust that our customers have in us.
If you have any questions, or concerns, please feel free to reach out to me and I shall be happy to discuss. Any comments would be addressed and are welcome, as well.
Therefore, let us embrace Obesrvability and make our customers’ experience a more reliable one.
