Let us start with understanding what Gray Area Failure could mean. It wouldn’t be wrong if I said that, a Gray area is pretty much like a blind spot we experience while driving a car. Fortunately we have the blind spot indicators built into most cars, today. And building gray failure resiliency is almost equivalent to saying that we’re trying to design and implement blind spot indicators for our system, that can detect, notify and act upon any detected blind spots/gray areas.
In order to understand the factors that affect the gray areas, it is best to start with understanding the root cause of this issue – Differential Observability, a concept, that explains how different the observations could be, of the same subject, but from 2 or more observers’ perspectives. The following diagram helps us get a better picture of what’s happening.
Differential Observability
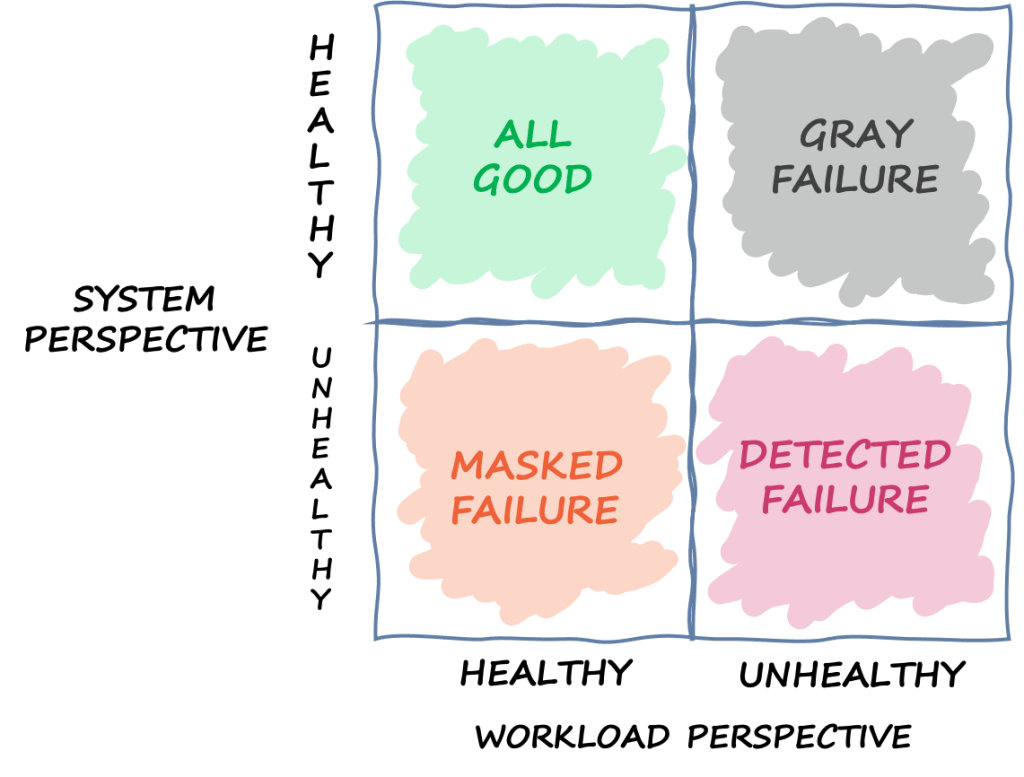
From the above diagram which illustrates the differences in perspectives of a System Health check and that of a workload, we can infer that a gray area is very much similar to a blind-spot while driving a car. Unfortunately, from a system health perspective, we do not have blind-spot indicators like the ones in most newer cars, that can detect the impact at its origin. As a result, this could in a way suppress the indicators of the impact until it reaches a threshold beyond tolerance levels. This wait in time could lead to multiple outcomes based on the severity of the underlying, issue in its growth phase. But, any such impact cannot blind a workload. Workload always will feel the impact right away; but needs to be configured in such a way that it can observe such an impact and raise an event that can be propagated to various components that are capable of handling this event.
The basic idea on which this concept relies is that, the data and control flows are mostly monitored by the cloud provider’s system health check, where every node in the system is pinged for a response and is validated for its presence and health. However, due to the shared responsibility boundaries, AWS refrains from accessing or monitoring certain data or control flow paths, that are internal to our system components, such as the ones designed by AWS’ customers (which is us in this case, who architect the system that leverages AWS) For instance, an app server interacting with a database server both living in 2 different AZs. The AWS system health checks do verify if the app server and the DB server are both alive individually. However, since the connection between the two components could be dependent on several factors, such as internet connectivity, or a simple network policy wrongly configured that is blocking the app from accessing the DB server or the DB server from receiving any requests, essentially making the DB server unreachable to the app server. In such cases, the drop in the quality of service of the app server experienced by the end users, due to its poor connectivity with the DB server is not detected by the System Health Check.
If that made sense, then one might ask, why can we not monitor the connectivity between the components too. That’s a fair ask I’d say. In order to understand the rationale behind this behavior, I think an example wouldn’t hurt. I never failed to resonate with what one of the greatest scholars of all time, once said –
“Example isn’t another way to teach, it is the only way to teach”,
– Albert Einstein
Let’s start with an example, which we all can relate to. Here’s the apartment complex I live in that made me correlate to the AWS’ service model and thought I could use it to explain AWS’ architecture with respect to a real life structure.

The AWS Building
You can imagine it this way – if AWS is the real estate firm and has constructed an apartment complex as shown below, that is comprised of about 20 floors with around 20 private homes on each floor. AWS takes the responsibility of enforcing security and monitoring the connectivity between these houses and would have it fixed if there arises an issue in connectivity between the houses. Also, let’s not forget that, AWS guarantees that it performs regular health checks on each room in each private home, individually to ensure that each room is usable, be it bed, bath, kitchen or living room. Here each of the rooms can be correlated to an active component in our system, such as an app server on an EC2 instance (bedroom), a Database server (kitchen) where all the the data is cooked to a recipe and returned upon request haha Hope we’re relating better now.
But, if there is a problem “within a house”, connecting the bedroom and the kitchen, that is making a person in the house unable to use the kitchen to cook a recipe that was promised to be delivered to a neighbor (analogous to another app service waiting on this response) within the same building who is awaiting the delivery (a dependency), then that’s a blind spot or gray area! The house slowly gets into a stage where the health checks could start failing as the kitchen is on fire and finally fails a health status check by AWS.
Two outcomes possible:
1. Kitchen catches fire and gets detected by the AWS’ system health check.
2. The neighbor (dependency) raises a concern about their expectation not being met with the Apartment Community members. Escalation basically.
In both of the above cases, there is a wait time that could have totally been avoided, that could have saved our kitchen from catching fire. You may ask, how? By simply raising an event or notifying the neighbor on not being able to meet the expectation due to a disconnect between the bedroom and kitchen. Now this part can be correlated to our observability and monitoring around our components that process the workloads such as our app servers (back-end or front-end).
Of course, although, AWS’ security staff is able to determine that both the bedroom and the kitchen are in working condition, by probing each component individually, their interdependency is not validated. Therefore, according to the security check from the external gives an impression that all the rooms and kitchen are individually healthy and usable. If you asked me why? I’d say, we bought this private dwelling space from AWS because, they offered the infrastructure and maintenance of the building along with parking, parks. club house etc., which would’ve been ultra expensive to just construct for ourselves and works out way more economically if built for consumption by a group of people instead. Furthermore, We wouldn’t want AWS’ security people roaming inside our houses, right. We wanted privacy and so did we move into a private home. This resonates pretty well with the shared responsibility model. Here, to raise a concern about the bedroom-kitchen disconnect would become a client responsibility.
We can see how differential observability comes into picture, here. If we wanted to relate this scenario to the diagram at the top of this article, then AWS’ security checks correspond to the system health checks around each component individually; while the workload perspective corresponds to that of the dweller who was disconnected from accessing the kitchen, to deliver further. And hence, the connectivity between bedroom and kitchen becomes the gray area. At the same time, an important aspect to consider is that, these private homes can be considered analogous to the provisioned services in AWS such as EC2 instances or Aurora RDS; while fully managed, server-less offerings of AWS’ services could be analogous to the cooking gas pipeline which AWS takes care of completely and the dwellers have no access to manage it, but only its end user.
Here we can deduce an important point:
Gray areas are mostly around applications services that process the workload from users and become irrelevant as we move toward fully managed services, as we do not want AWS’ security personnel walking inside our private homes.
A bit of a rationale behind this: an app server can be considered as a pro-active that initiates communication with other components in the system, such as a database server; while a database server is a reactive service which only reacts to the requests/stimulus it receives. Therefore, a database server wouldn’t be taking the responsibility of checking if the app server is able to interact with it. Instead, it would be fair to say that the app server takes the responsibility of connecting to the database server and also take the impact if it is unable to. Hence, the shared responsibility model would also expect the app server to have raised concern at the earliest and at the same time keeping the signal to noise ration as high as possible, by not raising false positive alarms.
Identifying these gray areas at their earliest of stages, raising an alert or notification and providing alternative routes for the traffic destined to such nodes allows us to contain the impact and have our services highly available to our clients. Hoping that, this is making sense and is helping us visualize a gray area coming into existence, let us now take a look at an example in AWS to relate better with the same.
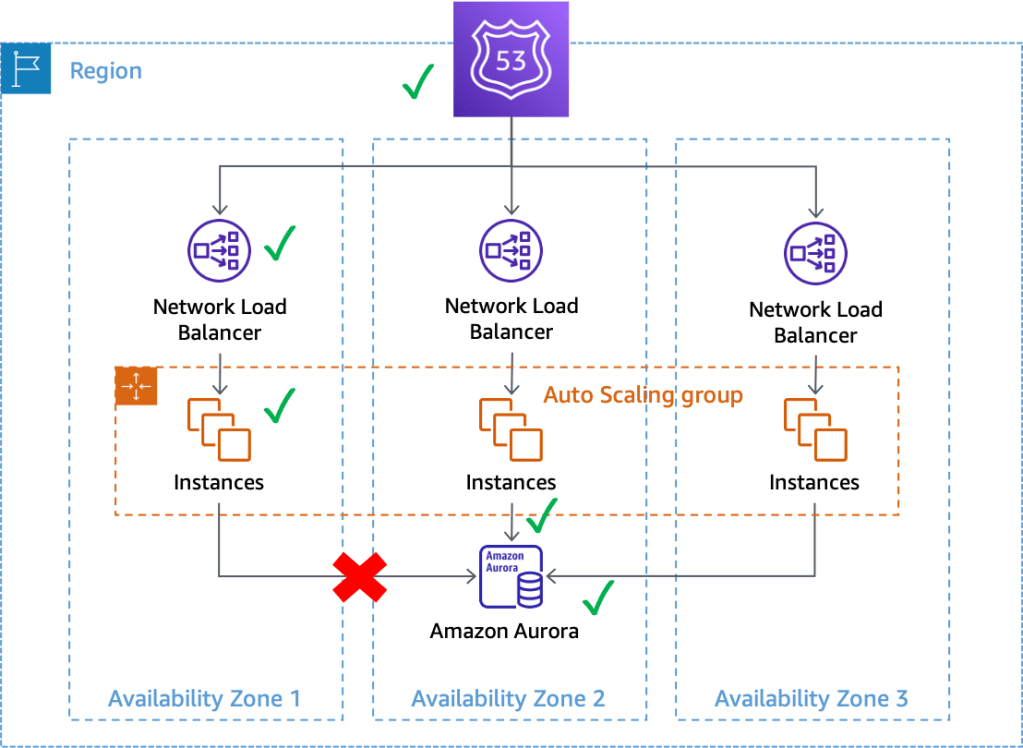
We can observe from the above diagram that, the app instances in AZ1 pinged by the NLB and the Amazon Aurora database server in AZ2 within the same region are both individually passing the system health checks performed by AWS, which means they are up and running individually, while their interaction with each other is unchecked and there has been a network connectivity interruption making the database inaccessible to the app server instance. X RED FLAG!!
Best part of this gray area failure is that it is always felt by or detected by, at its most rudimental stages, by services that talk to other components to serve the requests received, such as an app talking to a database feeling the impact, when the network connectivity between itself and the DB server goes down; versus the DB server feeling the network disconnect first (most unlikely) because, the DB server would only respond to the request from the app and if the app does not request anything from the DB server, then there is no way that the DB server would know that its connectivity with the app server is down. The AWS’ security personnel would not come into our house to fix the kitchen unless we asked them to, because it is our private space, right?
Therefore, strategically, it becomes very important to solve this problem from its origin of impact, so we can address it at the earliest than waiting for it to develop into a gray area and snowball the effect that has to trickle up, to the next higher level to be touching the threshold set collectively for the resources at its (the app server’s) level of hierarchy.
Thus, if we observe in the above diagram, we can see that the gray area is always viewed as healthy by the system and also the service that is reactive to the requests, while it is viewed or felt as unhealthy by the app server which tried initiating a contact with the DB server to fulfil its data request.
Therefore, if we observe in the diagram below, it becomes important to have secondary thresholds that could alert or send out an event notification, in cases where the exceptions or anomalies occur, instead of swallowing them, by assuming they are innocuous to the system and not logging them at error level logs with exception stack-trace objects, that could snow ball quickly otherwise that could bubble up and get propagated to reach the end user in some cases making it a client impact. This could have totally been avoided if we had alerts set up at lower levels of infrastructure such as our EC2 instances on which our business applications run.

The above diagram illustrates a flawed design, where the drop in the quality of service of apps 1, 2 and 3 individually, is assumed to not be a threat to the overall system performance, while assuming which the distribution of drop in Quality of Service is not really taken into consideration. Because, in the above setup, the average latency could be under 60ms, while app3 could be facing a connectivity issue due to which its latency could have worsened to 65ms. However, since app1 and app2 are doing better than usual at a low latency of 50ms and 45ms respectively, the average latency would come up to:
(50 + 45 + 65)/3 ms = 53.3ms which qualifies the system health checks to pass through, while app3 has been severely impacted.
Therefore, it boils down to the fact that, individual app level thresholds should be calibrated in an iterative fashion (should not be stagnant values set and forgotten forever or until the next impact is felt) based on the business operation the service carries out and its criticality in terms of client impact. Hence designing the SLIs1 that can reflect the SLAs2 and SLOs3 most accurately.
Now that we have understood what a gray area failure is and how it could be prevented or handled best, we can move on to understanding how to respond to a gray area or an unavoidable impact that has exploded with a large blast radius of nearly the region and is leaving us with the only option to invoke a disaster recovery based on a strategy in place, that can allow us to maintain the availability of the services as promised to our clients. You can get a better understanding of what Disaster Recovery means and the strategies to achieve a successful recovery, here How to Strategically recover from a disaster?
Thank you, for the read. Please post any questions, if you may have. Appreciate your time.
1 SLA – Service Level Agreement
2 SLO – Service Level Objective
3 SLI – Service Level Indicator
Designed with WordPress.com
